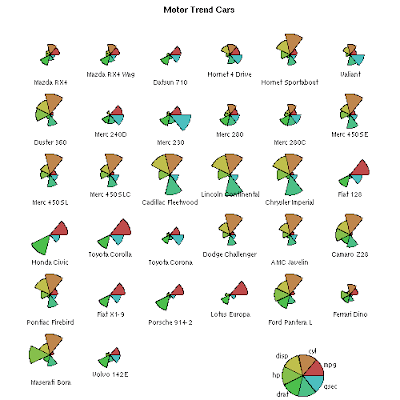
Starplots allow the viewer to compare multiple variables in each observation. In this example, each symbol is representing a different automobile type while the different color radii represents different characteristics each car has. For instance, the red reprints miles per gallon and the light green symbolizes horse power. These graphs are very efficient because they allow easy visualizations to give so much information.
No comments:
Post a Comment